Author name: arymalabs@dmin

Unpacking the granularity problem in MMM

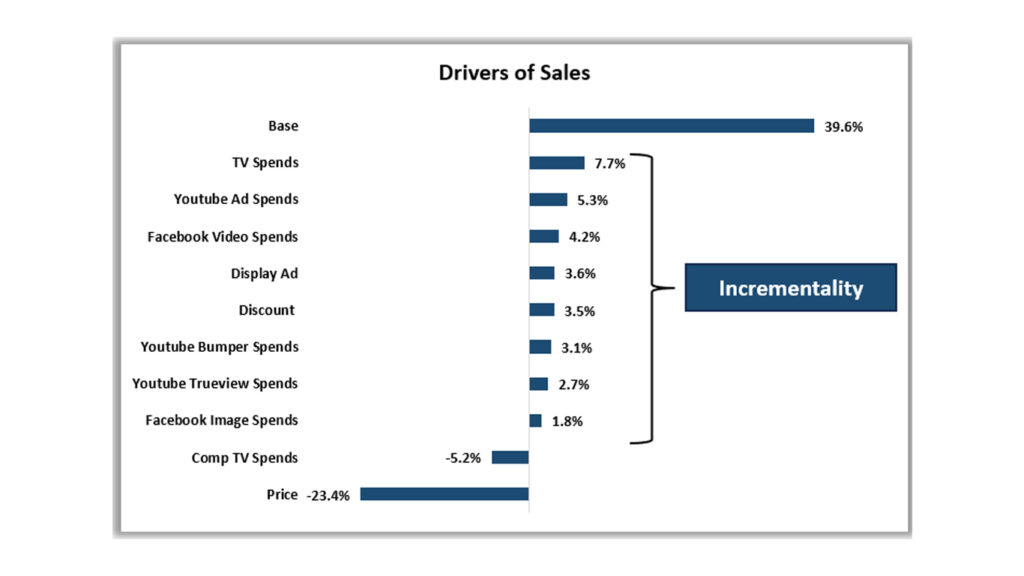
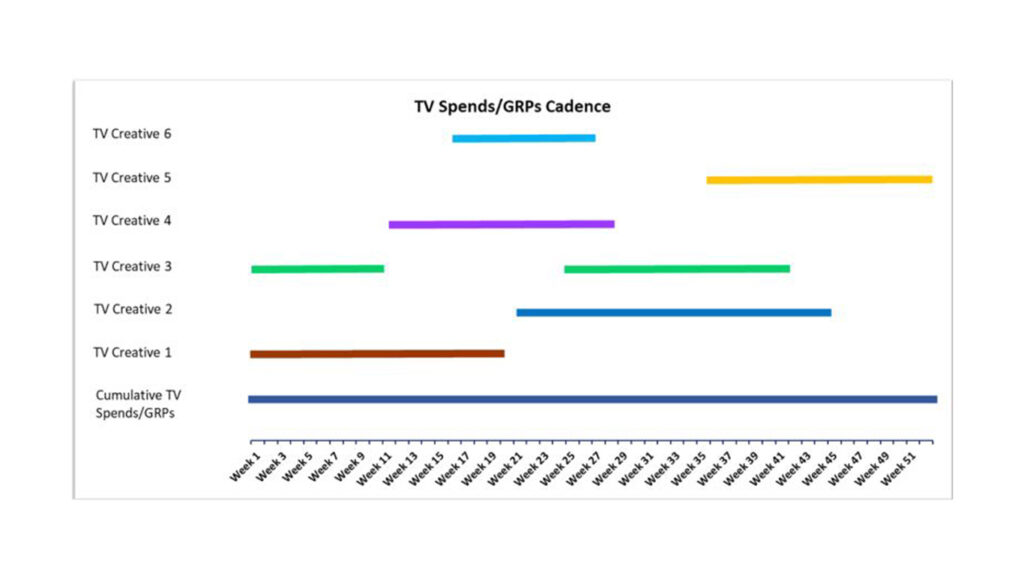
One of the complaints many have with respect to MMM is that it does not provide granular insights. While there are multiple solutions to this problem (will talk about this in future posts), let me unpack the granularity problem. So what is the Granularity problem? Lets take the example of TV. Many brands spends lot […]

Unpacking the granularity problem in MMM Read More »

What? MMM has inbuilt Incrementality testing?

Did you know MMM has inbuilt Incrementality testing? Let me elaborate. Incrementality is defined as the additional impact of a marketing on the KPI (sales, TOMA, CAC etc..) over and above what would have been generated organically. Recently, we had an interesting conversation with a brand that ventured into TV ads since past one year.

What? MMM has inbuilt Incrementality testing? Read More »

Boost your incrementality testing through Causal Experiments

During the Black Friday – Cyber Monday (BFCM) period, we often notice that brands increase their marketing spends, roll out discounts, try new media channels and launch new campaigns. The resultant sales for some of these brands during this period is higher than any other period in the year. But most marketers still don’t have

Boost your incrementality testing through Causal Experiments Read More »

Why Heteroscedasticity matters in Marketing Mix Modeling

MMM is something that always leads you to reminisce about the learning one had or hadn’t during their statistics course. 15 years ago, when I was a student, I attended one statistics seminar. In it the professor told “Always be testing your assumptions”. That statement rings true even now, especially in MMM. In MMM, inference

Why Heteroscedasticity matters in Marketing Mix Modeling Read More »

MMM pro tip: Use spends instead of Impressions

1. Spends are more actionable and transactional, as you can measure direct impact on sales. Spends data directly reflects the financial investment in marketing (your CFO would be happy 😅). 2. Spends are more accurate than impressions. 3. Cross-Channel Comparisons Spend data enables easier comparisons between different marketing channels or campaigns in terms of their

MMM pro tip: Use spends instead of Impressions Read More »

Market Mix Modeling 101 — Part 2 (Contribution Charts)

In this article, I would like to explain — How to interpret Contribution charts and what are the common pitfalls to avoid. So, what is a Contribution Chart? Contribution Chart is a visual way of representing what marketing inputs drive sales and how much is the impact of each marketing input. It always helps to ease the

Market Mix Modeling 101 — Part 2 (Contribution Charts) Read More »

Scroll to Top